
 Contact Us

Procurement Spend Analytics Software That Shows Where Every Rupee Goes
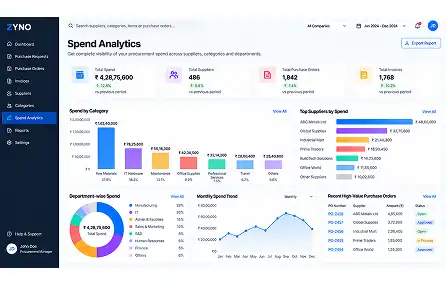
ZYNO Spend Analytics brings purchase orders, invoices and contracts from ZYNO Procurement into one dashboard. Analyse spend by supplier, category and department, flag off-contract buying, and find savings before your next negotiation.
Flagged while PO is open
2 flagged for review


What Is Procurement Spend Analytics Software?
Procurement spend analytics software collects purchasing data from purchase orders, invoices and contracts, classifies it by supplier, category and department, and shows where money goes. Procurement and finance teams use it to find savings, spot off-contract purchases and prepare supplier negotiations.
Why Procurement Teams Lose Sight of Spend
Most teams know total spend. Few can say, this week, which suppliers, categories and departments drive it, and which purchases skipped the contract.
Spend data sits in too many places
Purchase orders, invoices and contracts live in separate systems and spreadsheets, so nobody can say which suppliers or categories take the biggest share of budget.
- No single view across departments
- Hours lost consolidating each cycle
- Decisions made on stale numbers
Off-contract purchases go unnoticed
Staff buy from non-approved vendors or outside negotiated contracts, and you find out at invoice stage, after the rate is already lost.
- Lost volume discounts
- Unapproved-supplier risk
- No early warning
Spend reports arrive too late
A supplier-wise or category-wise report built by hand takes days, so budget decisions rely on last month’s numbers.
- Manual exports and reconciliation
- Reports outdated on arrival
- No drill-down to the cause of overspend
Savings stay hidden
Duplicate suppliers, price differences on the same item and split volumes go unseen, so contracts renew without renegotiation.
- No comparison with past spend
- Same item, different prices
- Savings found after the contract is signed
What ZYNO Spend Analytics Does
Spend visibility dashboard
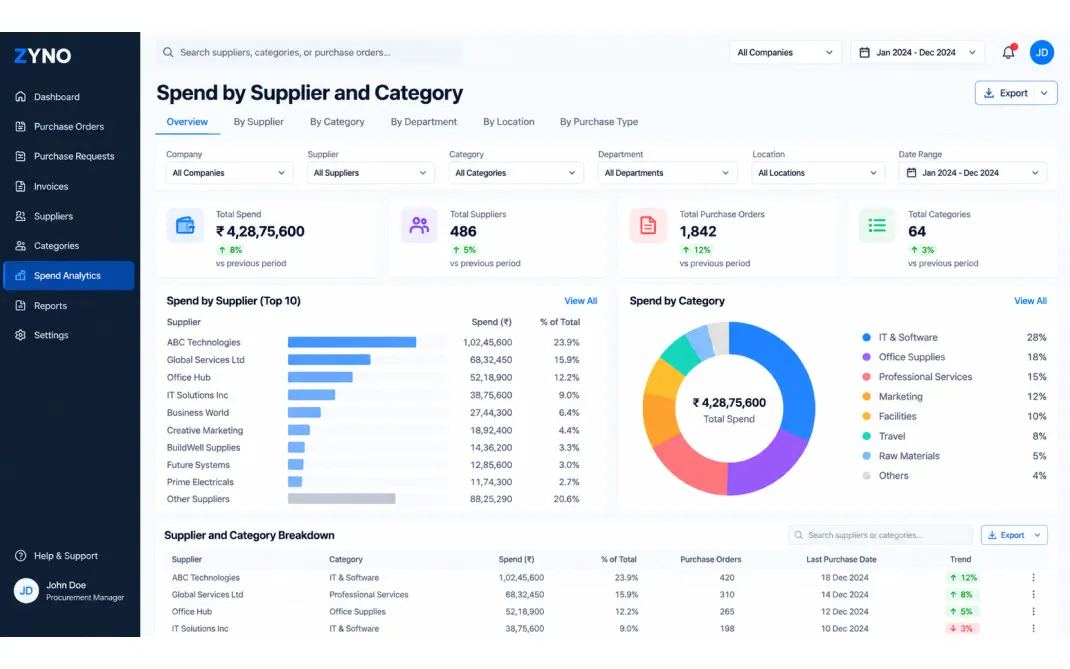
See total spend by supplier, category, department and period in one view. Filter to the question you are asking, for example which five suppliers took the largest share of last quarter’s budget.
Automatic spend classification
AI assigns each purchase to a supplier, category and department so you do not clean spreadsheets before analysing. Review and correct categories where needed.
Supplier spend analysis
Compare spend, price and purchase volume by supplier. Spot suppliers delivering the same item at different prices and shortlist consolidation candidates.
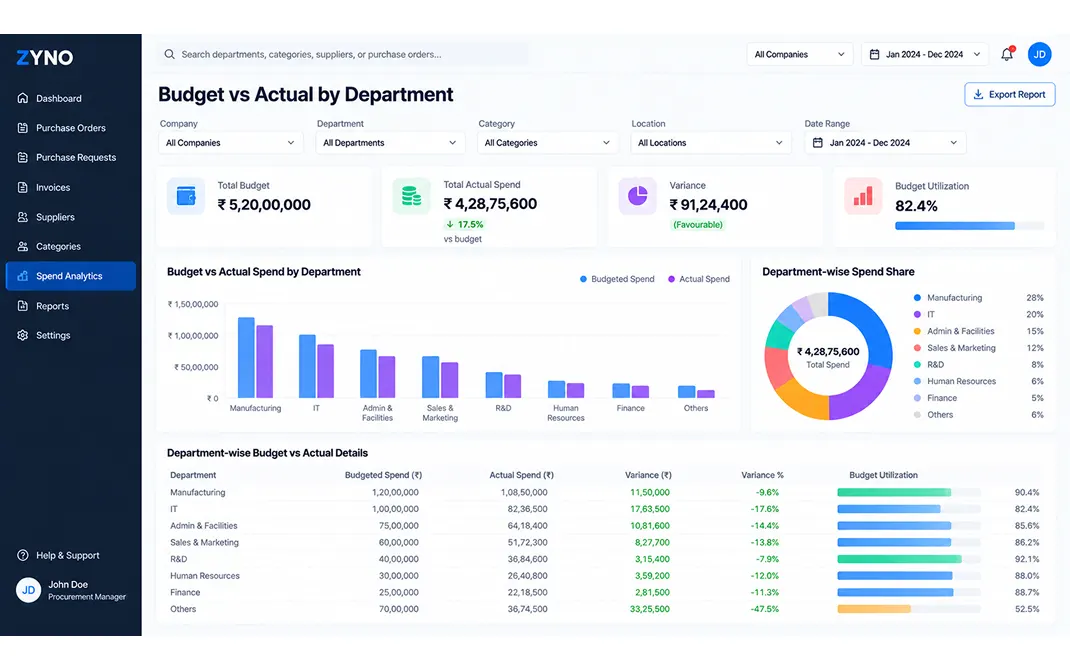
Budget vs actual tracking
Compare actual spend with allocated budgets by category and department, with alerts before a limit is crossed.
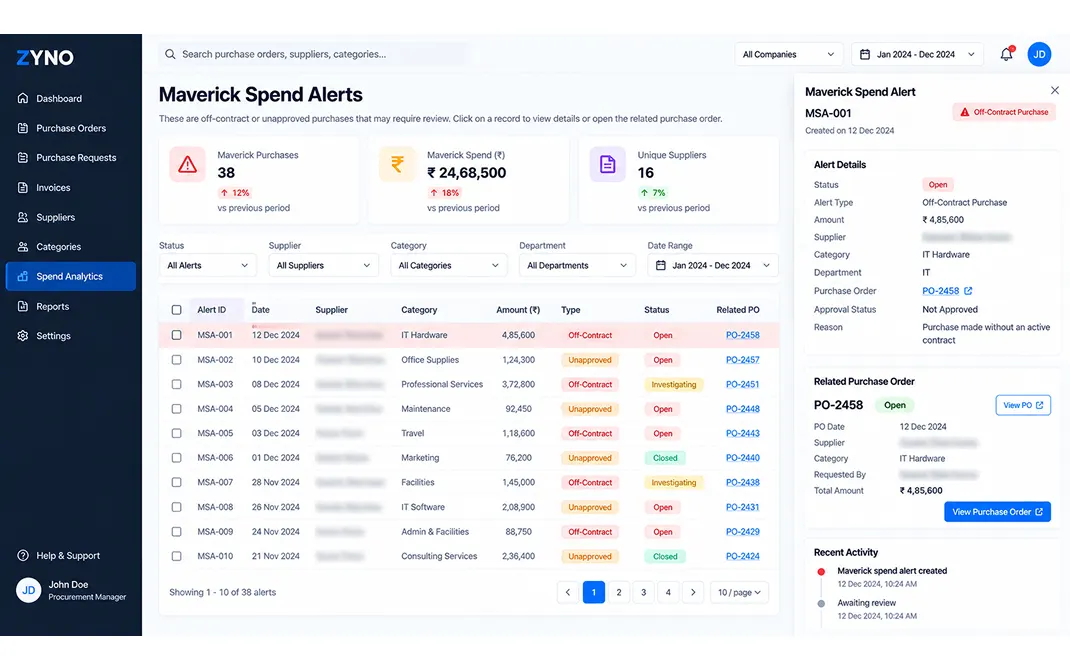
Maverick spend detection
Flag purchases made outside approved vendors or contracts as they occur, so your team can act while the order is still open.
Reports and drill-downs
Build supplier-, category- and department-wise reports, drill down to the underlying PO or invoice line, and export for finance review.
See the ZYNO Spend Analytics Dashboard
A walk through the views your team will use most.
In the demo we show these views using your supplier and category structure.
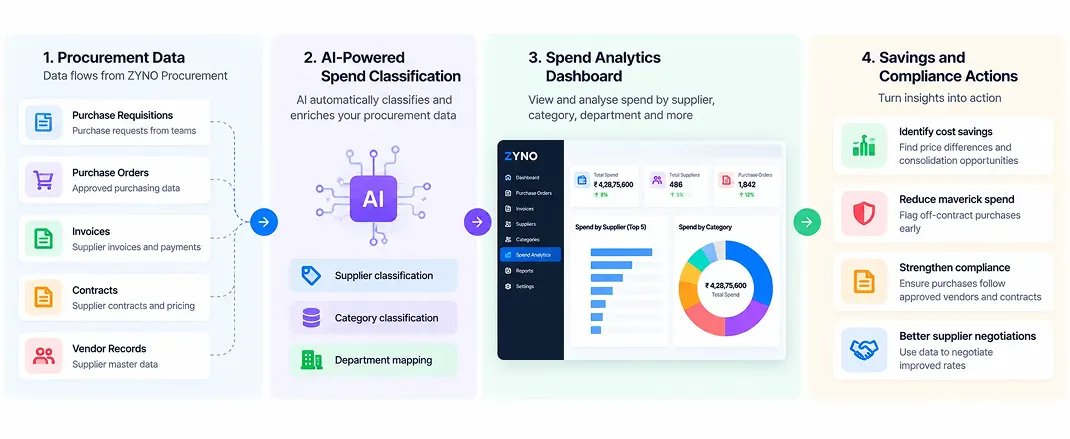
How ZYNO Spend Analytics Works
Collect
Spend data flows from ZYNO Procurement: purchase requisitions, purchase orders, contracts, vendor records and invoices.
Classify
AI groups every record by supplier, category and department.
Analyse
Spend is compared with budgets and past periods; unusual transactions and off-contract purchases are flagged.
Act
Use the findings to renegotiate contracts, consolidate suppliers and correct buying habits, using Vendor Management and Contract Management in the same platform.
AI in Spend Analytics: What ZYNO Automates
Classification
AI categorises transactions by supplier and category.
Anomaly detection
Flags unusual transactions, price spikes and duplicate payments.
Spend forecasting
Projects future spend from historical trends, seasonality and category patterns.
Savings recommendations
Suggests where to renegotiate or consolidate, based on your spend and supplier data.
Who Uses ZYNO Spend Analytics
Built for manufacturers, garment and apparel makers, and distribution and trading companies. Supports businesses in India, the UAE and Kenya.
Standalone Spend Analytics Tool or Analytics Built Into Your Procurement Platform?
Buyers choose between a dedicated analytics tool and analytics inside the procurement system. Here is how they differ.
Get a Personalized Demo of ZYNO Procurement
See how ZYNO can streamline purchasing, vendor management, approvals, quotations, procure-to-pay and spend visibility in one connected procurement platform.
- ✓Walk through the views using your supplier and category structure
- ✓See off-contract purchases flagged down to the purchase order
- ✓Usually responds within 2 hours
Book a Spend Analytics Demo
Frequently Asked Questions
What is procurement spend analytics software?
Procurement spend analytics software collects purchasing data from purchase orders, invoices and contracts, classifies it by supplier, category and department, and shows where money goes. Teams use it to find savings and control off-contract buying.
How is spend analytics different from spend management?
Spend management is the full process of controlling spend. Spend analytics is the data layer inside it: classifying, analysing and reporting spend so decisions are based on facts.
What data does ZYNO Spend Analytics use?
It uses data from ZYNO Procurement: purchase requisitions, purchase orders, contracts, vendor records and invoices.
Can I analyse spend by supplier, category and department?
Yes. Filter the dashboard by supplier, category, department or period, and drill down to the underlying purchase order or invoice line.
How does ZYNO detect maverick spend?
ZYNO flags purchases made outside approved vendors or contracts as they occur, so procurement can investigate while the order is open.
How often does the dashboard update?
The dashboard updates as purchase orders, invoices and contracts are processed.
How does spend analytics help reduce procurement costs?
It shows duplicate suppliers, price differences and off-contract buying, so you can consolidate suppliers and renegotiate rates. Savings depend on the actions you take.
How much does ZYNO Spend Analytics cost?
It is part of ZYNO Procurement and priced on your requirements. See the pricing or book a demo for a quote.
Does ZYNO use generative AI for spend analysis?
Yes. ZYNO uses AI-powered spend analysis to help procurement teams analyse purchasing data, identify spending patterns, detect anomalies and uncover potential cost-saving opportunities. By turning procurement data into actionable insights, ZYNO helps teams make informed decisions, improve spend visibility and strengthen cost control.
See where your spend really goes
In the demo we show these views using your supplier and category structure.
Book a Spend Analytics Demo
We show the dashboard using your supplier and category structure.

ZYNO Digital fuels smarter digital growth through data-driven marketing, creative storytelling, and performance strategies that boost visibility, engagement, and measurable business outcomes across global platforms.

ZYNO Tech delivers cutting-edge IT solutions — including web, mobile, and digital transformation services — helping businesses scale efficiently, innovate faster, and stay ahead in a connected world.

ZYNO AI harnesses the power of artificial intelligence to automate processes, enhance decision-making, and deliver predictive insights — driving innovation, agility, and measurable business growth.

ZYNO by Elite Mindz offers AI-powered products and services that unify operations, boost productivity, and drive digital transformation — helping businesses scale smarter and innovate faster.
Tell us what you need, and we'll get back with cost & timeline
* In just 2 mins you'll get a response
* Your idea is 100% protected by our Non-Disclosure Agreement
ZYNO Procurement
To Support Your Every Procurement Needs
With 15+ years of expertise, 300+ professional developers, and trusted by 1000+ businesses ZYNO Procurement offers top-notch procurement app to enhance your business’s productivity and security.
Trusted by leading companies worldwide







Get In Touch With Our IT Experts
Complete the form and discuss procurement strategies with our experts.