×
Mail sent successfully. Please check your mail-box.
ZYNO POS is a complete Sales Analytics Dashboard and Sales Data Analysis platform built for retailers, restaurant operators, supermarkets, and multi-outlet businesses who need accurate, real-time sales intelligence at every level of the organisation. This Analytics and Sales platform centralises every transaction, product performance metric, customer behaviour insight, and outlet comparison report in one dashboard.
ZYNO Digital fuels smarter digital growth through data-driven marketing, creative storytelling, and performance strategies that boost visibility, engagement, and measurable business outcomes across global platforms.
ZYNO AI harnesses the power of artificial intelligence to automate processes, enhance decision-making, and deliver predictive insights — driving innovation, agility, and measurable business growth.
ZYNO Tech delivers cutting-edge IT solutions — including web, mobile, and digital transformation services — helping businesses scale efficiently, innovate faster, and stay ahead in a connected world.
Mail sent successfully. Please check your mail-box.
Years of Digital Experience
Happy Clients
Projects Delivered
Client Retention
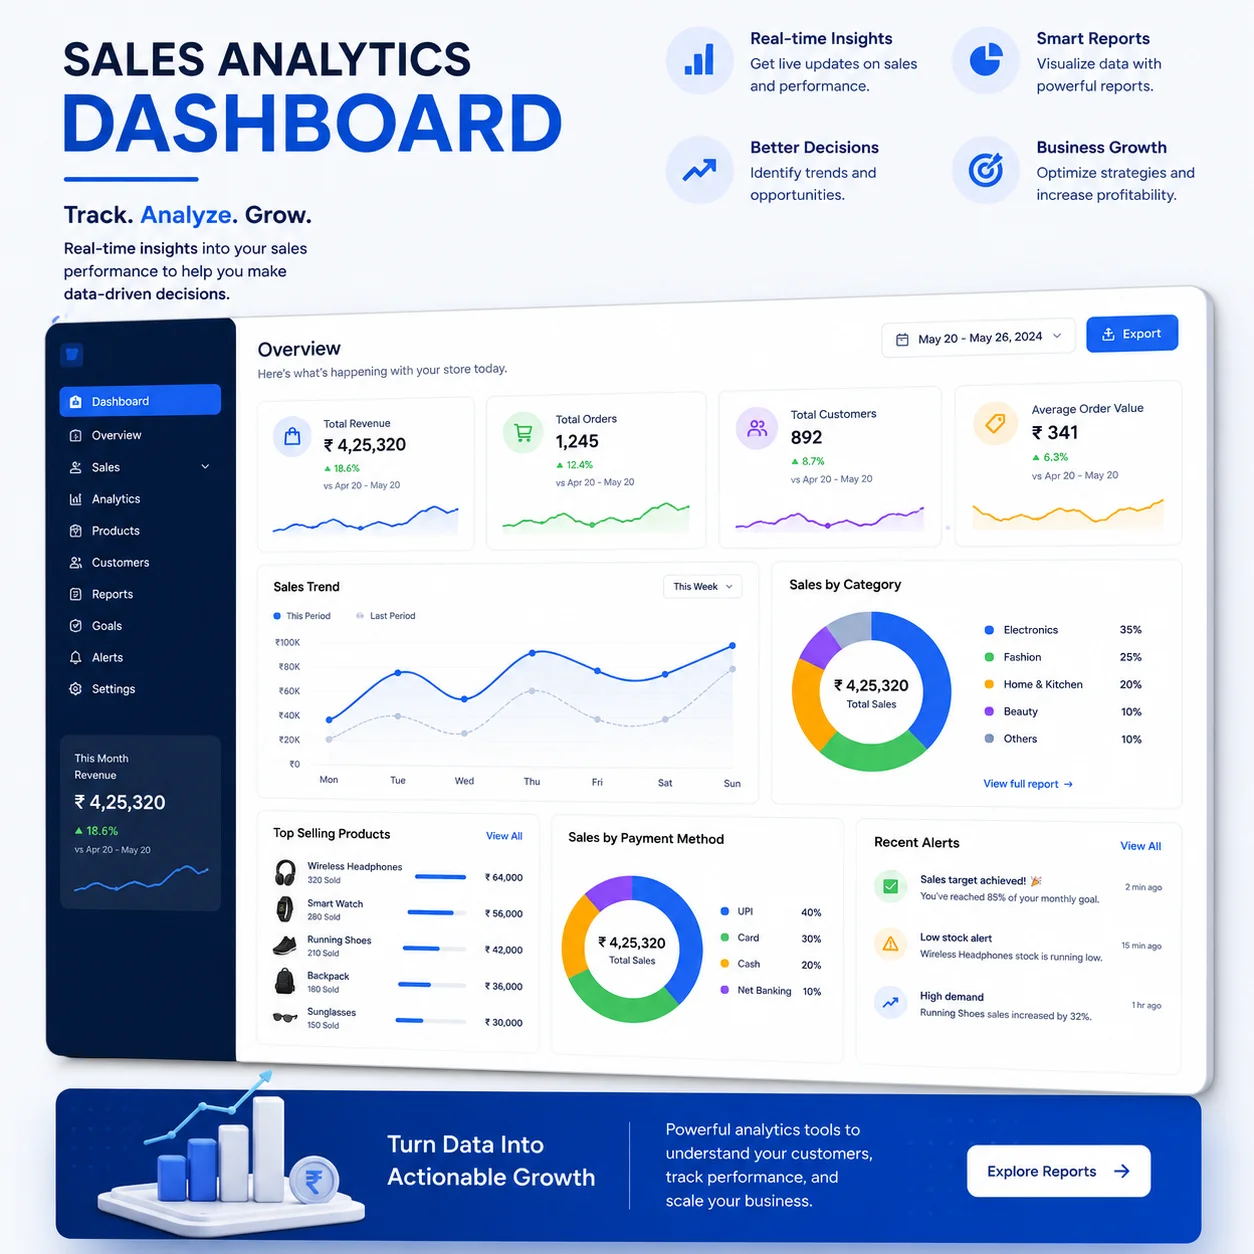
ZYNO POS's Sales Analytics Dashboard transforms every billing transaction into real-time business insights, helping businesses track product performance, customer behavior, sales trends, and outlet performance from a single dashboard. It eliminates manual reports and provides accurate, data-driven insights for faster, smarter business decisions.
ZYNO POS's Sales Analytics Dashboard displays real-time sales performance across every outlet simultaneously, showing live revenue, transaction count, average bill value, gross margin, top-selling products, and payment mode breakdown for the current trading day. Business owners see the complete network sales picture on their mobile phone or desktop the moment transactions are completed at every counter, without waiting for store managers to compile and submit end-of-day sales reports.
ZYNO POS's Sales Data Analysis module analyses product performance across every dimension, revenue contribution, units sold, gross margin per unit, margin percentage, return rate, and sales velocity, for every SKU, every product category, and every brand in the catalogue. Fast-moving, high-margin products are identified for purchasing priority and promotional emphasis.
ZYNO POS's Sales Analysis Dashboard generates hourly sales heat maps, showing revenue, transaction count, and average bill value for every hour of the trading day, every day of the week, across every outlet. Business owners identify their highest-traffic trading periods and their slowest hours with precision, enabling smarter staffing decisions that ensure the right number of cashiers are at the counters during peak periods and labour costs are reduced during predictably slow periods.
ZYNO POS's Data Analysis in Sales module analyses customer purchase behaviour, segmenting the customer base by visit frequency, average spend per visit, preferred product categories, payment mode preference, loyalty tier, and recency of last visit. High-value, high-frequency customers are identified for premium loyalty investment. Lapsed customers those who have not visited within a defined period are flagged for win-back campaigns.
ZYNO POS's Sales Data for Analysis module calculates gross margin at the transaction, product, category, outlet, and time period level, comparing selling price against the current weighted average cost to generate real-time margin reports that show exactly how profitable every part of the business is at every moment. Business owners see the impact of promotional discounts on category margins and identify product categories where pricing is insufficient to maintain target margins.
ZYNO POS's Sales Analytics module breaks down every payment mode- cash, credit card, debit card, UPI, digital wallet, loyalty redemption, and credit account- by revenue contribution, transaction count, and percentage share for every outlet and every time period. Payment mode analytics inform decisions about payment processing costs, cash handling procedures, and digital payment promotion strategies.
ZYNO POS's Sales Data Analysis module tracks individual cashier performance, measuring revenue processed per shift, average transaction value, discount authorisation frequency, void and return rates, and transaction processing speed for every cashier across every outlet. Cashier performance data gives store managers objective criteria for performance reviews, training needs identification, and scheduling decisions.
ZYNO POS's Data Analysis in Sales module measures the revenue and margin impact of every promotional scheme, comparing sales volume, transaction count, average bill value, and gross margin during the promotional period against the same metrics in the pre-promotional baseline period for every product and outlet included in the campaign. Business owners see exactly how much incremental revenue each promotion generated, what it cost in margin, and whether the net impact was positive.
ZYNO POS's Sales Analytics Dashboard integrates sales velocity data with inventory management, showing stock turnover rates, days-of-cover remaining at current sales pace, and products approaching reorder level for every SKU at every outlet. Procurement teams use sales velocity analytics to make data-driven purchasing decisions, buying more of products that are selling fast, reducing purchase quantities for slow-moving categories, and timing purchase orders to minimize both stockout risk and excess inventory accumulation.
ZYNO POS is more than just a Sales Analytics Dashboard. It is a complete retail and restaurant management platform that connects sales analytics to inventory management, customer loyalty, procurement, finance, and business reporting, all in real time, from one system, so every team from store manager to business owner makes every decision from the same live transaction data across every outlet and every channel.
ZYNO POS stands out as the best Sales Analytics Dashboard and Sales Data Analysis platform for retailers, restaurant operators, and multi-outlet businesses. Unlike generic BI tools that require separate data integration projects or manually compiled sales reports that are outdated before they are read, it combines Data Analysis in Sales, Analytics and Sales, Sales Analysis Dashboard, and Sales Data for Analysis into one seamless platform.
ZYNO POS's Sales Analytics Dashboard gives business owners and managers live transaction data from every outlet at every moment, replacing the end-of-day sales calls, manually compiled branch reports, and weekly management meeting guesswork that currently drive most retail and restaurant operational decisions. Real-time intelligence means problems are identified and addressed on the same day they occur, before they compound into significant revenue or margin losses.
ZYNO POS's Sales Data for Analysis module connects sales velocity, margin data, and customer behaviour insights directly to the operational decisions that determine business profitability, buying the right products in the right quantities, pricing products to protect margin while remaining competitive, and staffing counters to match actual trading demand. Every decision backed by live data is more accurate and more profitable than the same decision made on intuition or outdated manual reports.
With built-in Analytics and Sales dashboards, promotional effectiveness measurement, category performance analytics, and customer behaviour segmentation, ZYNO POS gives marketing managers and business owners the data they need to design promotions that generate profitable incremental revenue, build product ranges that maximise category productivity, and invest loyalty programme resources in the customer segments that deliver the highest long-term revenue return.
ZYNO POS's Sales Analytics Dashboard and Sales Data Analysis platform deliver real-time product performance, customer behaviour, outlet comparison, and profitability analytics across every outlet, so your management team spends less time compiling sales reports manually and more time acting on the insights that drive better business performance every trading day.
A Sales Analytics Dashboard provides real-time insights into sales performance, revenue, profitability, customer behavior, and business trends. It helps businesses monitor key metrics through interactive dashboards and make data-driven decisions to improve overall performance.
A Sales Analytics Dashboard analyzes product sales, revenue, profit margins, inventory turnover, and customer demand. These insights help businesses identify best-selling products, slow-moving inventory, and opportunities to improve pricing and stock management.
A Sales Analytics Dashboard displays hourly and daily sales data, transaction volumes, and average order values. Businesses can identify peak business hours, monitor sales patterns, and optimize staffing, inventory, and promotional activities.
Sales Analytics Software groups customers based on purchase history, spending patterns, visit frequency, and buying behavior. These insights help businesses create personalized marketing campaigns and improve customer retention.
A Sales Analytics Dashboard provides consolidated reports that compare revenue, profit, transactions, inventory movement, and customer activity across different locations. This helps businesses identify high-performing stores and improve operational efficiency.
Sales Analytics Software calculates gross profit and profit margins by comparing product costs with selling prices. It also measures the impact of discounts, promotions, and pricing strategies to help businesses maximize profitability.
A Sales Analytics Dashboard tracks employee productivity using metrics such as sales completed, transaction value, billing speed, discounts approved, and return transactions. These reports help managers improve performance and operational efficiency.
Sales Analytics Software compares sales performance before, during, and after promotions. It tracks revenue growth, customer purchases, transaction volume, and return on investment (ROI), helping businesses optimize future marketing campaigns.
Yes. A Sales Analytics Dashboard automatically generates daily, weekly, and monthly reports covering sales, revenue, profit margins, top-selling products, payment methods, and business performance, reducing manual reporting efforts.
ZYNO POS provides a powerful Sales Analytics Dashboard that delivers real-time insights into sales, inventory, customer behavior, employee performance, and business profitability. It supports single and multi-store businesses with centralized reporting and actionable analytics for smarter decision-making.
Forgot Password
Experience smart, automated accounting—share your details and our team will guide you with a personalized demo.
Mail sent successfully. Please check your mail-box.