LIVE WEBINAR : Discover How Modern HRMS Can Simplify Your Entire HR Journey. | 12 August 2026 @ 5:00 PM IST Register Now
×
Become a Partner call Contact Us
Whatsapp
×
client 1
client 2
client 3
client 4
client 5
client 6
client 7
client 8
client 9
client 10
client 11
client 12
client 13
client 14
client 15
client 16
client 17
client 18
client 19
client 20
client 21
client 22
client 23
client 24
client 25
client 26
client 27
client 28
client 29
client 30
client 31
client 32

A Glimpse of AI Solutions for Our Client Worldwide

0+

Years of Digital Experience

0%

Happy Clients

0+

Projects Delivered

0%

Client Retention

Smart Analytics Tools & Solutions Built to Turn Construction Data Into Decisions


As the Best Construction Data Analytics Software for builders and contractors, it replaces manually compiled MIS reports, end-of-month Excel summaries, and fragmented site data, combining Construction Data Analysis, Site Performance Analytics, Construction MIS Reporting, and Best Construction Project Data Analytics into one connected platform that delivers the right data to the right person at the right time.

Project Performance Dashboard

Project Performance Dashboard

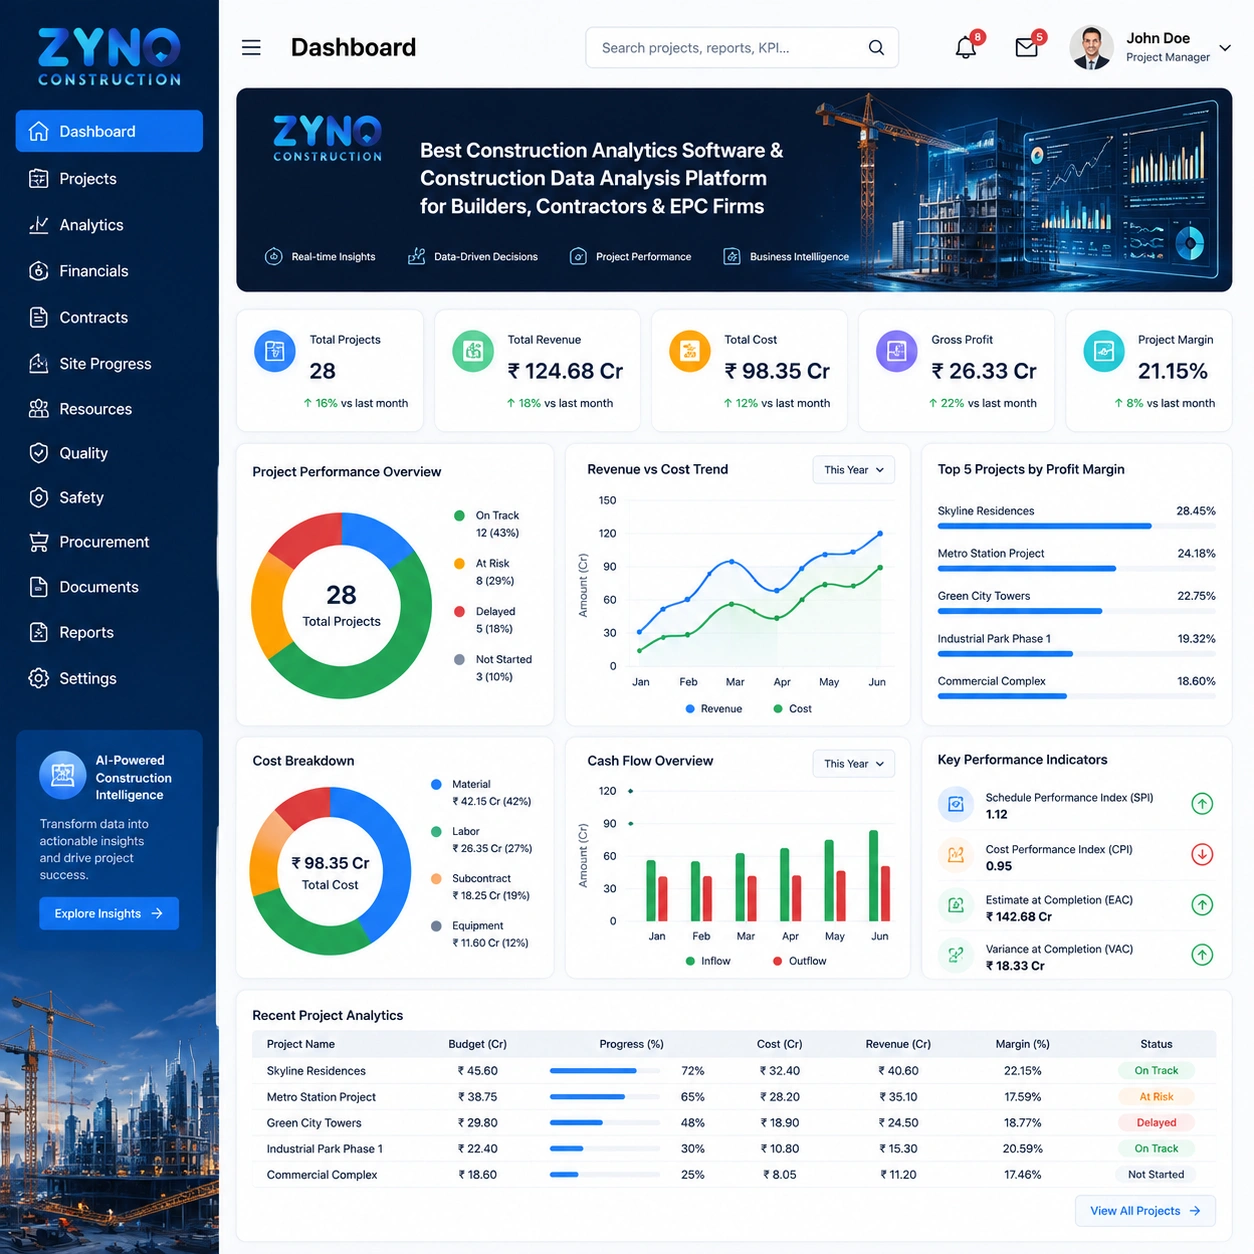
ZYNO Construction's Construction Analytics Software delivers real-time project performance dashboards, showing overall completion percentage, schedule health, budget utilisation, resource deployment, procurement status, quality NCR count, and cash flow position for every active project simultaneously. Project directors get an instant health check of every project in the portfolio without requesting manual status reports from individual project managers.


Construction MIS Reporting for Management Decision-Making

Construction MIS Reporting for Management Decision-Making

ZYNO Construction's Construction MIS Reporting module generates Management Information System reports across every business function, project progress MIS, procurement MIS, financial MIS, HR and payroll MIS, quality MIS, and subcontractor performance MIS.

Planned vs Actual Analytics for Cost & Progress

Planned vs Actual Analytics for Cost & Progress

ZYNO Construction's Analytics vs Reporting capability goes beyond standard report generation, delivering dynamic planned vs actual comparisons for project cost, physical progress, material consumption, labour productivity, and equipment utilisation at the activity, work package, project, and portfolio level.

Construction Data Analysis for Financial Performance

Construction Data Analysis for Financial Performance

ZYNO Construction's Construction Data Analysis module generates comprehensive financial analytics, project-wise P&L, cost-to-complete projections, revenue recognition tracking, margin analysis by project type and client, cash flow actuals vs forecast, accounts receivable ageing, and procurement spend by category. Finance directors and CFOs get the complete financial picture across the business without waiting for month-end accounts.

Site Performance Analytics for Daily Productivity Monitoring

Site Performance Analytics for Daily Productivity Monitoring

ZYNO Construction's Site Performance Analytics module measures daily productivity at the activity level across all sites, comparing actual output against planned targets, calculating productivity rates per trade and per equipment type, identifying underperforming activities and teams, and generating site efficiency scores across the full project portfolio. Site performance data is available in real time throughout the working day.

Best Construction Project Data Analytics for Portfolio Management

Best Construction Project Data Analytics for Portfolio Management

ZYNO Construction's Best Construction Project Data Analytics module gives project directors and PMO teams a portfolio-level analytics dashboard, comparing project health scores, schedule performance indices, cost performance indices, quality NCR rates, and collection efficiency across all active projects simultaneously. Projects are ranked by performance.


Analytics Report for Procurement & Supply Chain Intelligence

Analytics Report for Procurement & Supply Chain Intelligence

ZYNO Construction's Analytics Report module delivers procurement analytics — spend by vendor, spend by category, spend by project, PO-to-invoice cycle time, vendor delivery performance, three-way match exception rates, and advance recovery status — all visible in real time.


Reporting & Analytics for HR, Labour & Payroll Performance

Reporting & Analytics for HR, Labour & Payroll Performance

ZYNO Construction's Reporting & Analytics module generates comprehensive workforce performance reports, trade-wise attendance rates, absenteeism trends by site and contractor, overtime analysis, labour productivity by activity and team, payroll cost per project and per activity, statutory compliance status, and headcount deployment across the portfolio.


Construction Analytics Software for Quality & Safety Reporting

Construction Analytics Software for Quality & Safety Reporting

ZYNO Construction's Construction Analytics Software generates quality and safety analytics, NCR rates by project, activity, trade, and subcontractor; repeat defect patterns by defect type and root cause category; inspection pass rates by discipline and inspector; open NCR ageing by responsible party; and quality trend comparisons across projects. 


Construction ERP Software with Custom Report Builder

Construction ERP Software with Custom Report Builder

ZYNO Construction's Construction ERP Software includes a custom report builder — allowing finance teams, project managers, and analysts to configure their own reports by selecting data fields, filters, grouping criteria, calculation formulas, and display formats from the full dataset available across all connected modules. Custom reports are saved, scheduled for automatic generation at defined frequencies, and distributed to defined recipient lists automatically.


One Connected Platform for All Your Reporting & Analytics and Construction Data Analysis Needs


ZYNO Construction is more than just Construction Analytics Software. It is a complete Construction ERP Software that connects reporting and analytics to every operational and financial module, project management, procurement, finance, HR, quality, subcontractor management, and client billing, all in real time, from one system.

image
Executive Summary Report for Company Leadership
ZYNO Construction's Best Construction Data Analytics Software generates a daily or weekly Executive Summary Report, providing company directors and owners with a single-page summary of total portfolio progress, financial performance, collection status, procurement spend, workforce headcount, and quality NCR count across all active projects. The executive summary is generated automatically from live transactional data and distributed to the leadership team's inbox on schedule, giving directors the complete business picture before every management meeting without requiring any manual data compilation from the operations or finance teams
image
S-Curve Progress Analytics

ZYNO Construction's Site Performance Analytics module generates S-curve progress charts for every project, plotting cumulative planned progress against cumulative actual progress over the full project timeline. The S-curve makes it immediately obvious whether a project is ahead of, on, or behind the planned programme, and the slope of the actual curve shows whether production momentum is increasing or declining relative to the planned rate. Project directors use S-curve analytics to assess project health at a glance and decide where to concentrate management attention across a busy project portfolio.

image
Cost-to-Complete Analytics

ZYNO Construction's Construction Data Analysis module calculates cost-to-complete projections for every project, analysing costs incurred to date, remaining quantities from the live BOQ, current procurement rates, and planned resource requirements to project the total cost at completion. Cost-to-complete analytics identify projects where the projected final cost is trending above the approved budget, giving project managers and finance directors early warning of margin risk before the cost overrun is fully incurred and the opportunity to take corrective action has passed.

image
Subcontractor Performance Analytics

ZYNO Construction's Best Construction Project Data Analytics module measures subcontractor performance across five dimensions: progress consistency, quality NCR rate, programme adherence, safety record, and payment conduct, generating a composite performance score for every subcontractor across every project. Subcontractor performance analytics inform pre-qualification decisions, contract renewal negotiations, tender invitation lists, and performance improvement discussions.


image
Cash Flow Analytics & Forecast Reporting

ZYNO Construction's Construction MIS Reporting module generates cash flow analytics, comparing actual cash receipts and payments against the forecast for every period, projecting the cash position for the coming four, eight, and twelve weeks based on billing milestones, payment terms, and procurement schedules, and identifying the projects and clients that are creating the most significant cash flow risk to the business. Finance directors use cash flow analytics to make informed decisions about payment prioritisation, overdraft facility utilisation, and new project acceptance capacity.


image
Trend Analysis & Benchmarking Across Projects

ZYNO Construction's Analytics Tools & Solutions module compares performance metrics across projects, benchmarking cost per square metre, labour productivity per trade, material wastage rates, NCR rates, procurement cycle times, and collection days across the full project history. Trend analysis identifies whether company performance is improving over time, which project types deliver the best margins, and which operational metrics are consistently above or below the company benchmark, giving management the data to set realistic targets, reward genuine improvement, and focus process improvement investment where it will generate the greatest return.

Why Construction Teams Choose ZYNO Construction for Reports & Analytics

ZYNO Construction stands out as the Best Construction Data Analytics Software and best Construction Analytics Software for builders, contractors, and EPC firms. Unlike standalone BI tools or manually compiled MIS reports, it combines Construction MIS Reporting, Site Performance Analytics, Construction Data Analysis, Best Construction Project Data Analytics, and Analytics Tools & Solutions into one seamless system.

image

Eliminate Manual Report Compilation Permanently

ZYNO Construction's Reporting & Analytics platform generates every management report, project MIS, financial MIS, HR MIS, procurement analytics, quality reports, and executive summaries automatically from live transactional data on a scheduled basis. The hours your project managers, finance teams, and PMO staff currently spend every week compiling manual MIS reports from spreadsheets and system exports are eliminated.

image

Seamless Analytics & Project Operations Integration

ZYNO Construction's Construction ERP Software connects the analytics and reporting module directly to every operational module, so every report is generated from the same live transactional data used for procurement, payroll, quality inspections, and billing. There is no separate analytics database or data extraction process to manage, ensuring every report matches the real-time information displayed across all operational dashboards.

image

Smarter Construction Decisions with Real-Time Intelligence

With built-in Analytics Report dashboards, trend analysis, cost-to-complete projections, subcontractor performance scoring, and portfolio-level benchmarking, ZYNO Construction gives company directors and project management teams the real-time intelligence they need to run a more profitable, more efficient, and more competitive construction business, making better decisions faster, identifying risks earlier, and learning from every project to deliver better results on the next one.


Construction Reporting & Analytics Software

Gain Real-Time Visibility into Every Construction Project

Construction businesses generate large amounts of data every day through project planning, procurement, finance, billing, inventory, HR, payroll, equipment management, and site operations. Managing this information manually often results in reporting delays and limited visibility. ZYNO Construction Reporting & Analytics Software centralizes project data and transforms it into real-time dashboards, interactive reports, and meaningful business insights that support faster and smarter decision-making.

Make Better Decisions with Construction Analytics

ZYNO helps project managers and business leaders monitor every aspect of their projects from a single platform. The software tracks project progress, budget utilization, cost variance, profitability, resource productivity, procurement performance, and operational KPIs. Interactive dashboards display live project data, allowing teams to identify risks, monitor trends, and respond quickly before issues affect project timelines or budgets.

Automated MIS Reporting for Construction Businesses

Creating reports manually consumes valuable time and increases the possibility of errors. ZYNO Construction automates Management Information System (MIS) reporting by generating daily, weekly, monthly, or customized reports directly from live project data. Reports can be scheduled and automatically shared with project managers, finance teams, directors, and other stakeholders. This ensures everyone receives accurate, consistent, and up-to-date information without manual effort.

Custom Reports and Performance Dashboards

Every construction company has unique reporting requirements. ZYNO provides a flexible report builder that enables users to create custom reports using selected fields, filters, calculations, and KPIs. Users can visualize project performance through charts, graphs, and dashboards that simplify complex data into easy-to-understand insights. The platform also supports comparison of planned versus actual performance, helping businesses improve project control and operational efficiency.

Enterprise-Grade Reporting & Analytics Software

Whether managing a single construction site or multiple projects across different locations, ZYNO Construction Reporting & Analytics Software scales with your business. The platform supports enterprise-level reporting for contractors, builders, infrastructure companies, and EPC organizations by providing consolidated project dashboards, financial analytics, procurement insights, and executive reporting. By replacing spreadsheets with automated reporting and intelligent analytics, ZYNO enables construction companies to improve productivity, reduce reporting time, optimize costs, and make data-driven decisions that contribute to successful project delivery and long-term business growth.

Frequently Asked Questions (FAQ’s)

faq

Construction Analytics Software transforms data from project management, procurement, payroll, billing, and quality modules into real-time dashboards and reports. Analytics are generated automatically from live transactions, giving construction teams accurate insights without manual data compilation.


Construction MIS Reporting generates automated reports for projects, finance, procurement, HR, and quality using live transactional data. Reports are scheduled and distributed automatically, ensuring directors receive consistent, accurate, and real-time management information.


Analytics vs Reporting means reporting shows what happened, while analytics explains why it happened and predicts outcomes. Reporting delivers structured data summaries, while analytics provides trends, variance alerts, forecasting, and actionable insights for better decision-making.


Site Performance Analytics compares actual daily site output against planned targets. It tracks productivity by trade, equipment, and shifts, automatically flagging underperformance trends so management can take corrective action before delays impact project schedules.


Best Construction Project Data Analytics provides PMO teams with portfolio dashboards showing project health, cost performance, schedule metrics, quality trends, and collection efficiency. It replaces manual reporting with real-time visibility across all active projects.


Construction Data Analysis delivers project margin analysis, cost-to-complete forecasts, cash flow projections, spend intelligence, and receivables ageing. Finance leaders use these insights to identify risks early and improve profitability decisions.

Yes. Reporting & Analytics includes a custom report builder for selecting fields, filters, calculations, and formats. Reports can be saved, automated, and shared with stakeholders, providing tailored insights without manual report preparation.

Analytics Tools & Solutions compares current project performance with historical benchmarks across productivity, costs, wastage, quality, and collections. Trend analysis helps identify performance patterns and supports smarter project planning and operational improvements.


Yes. Construction ERP Software supports enterprise-grade analytics for large EPC firms with multi-project, multi-country, and multi-entity operations. It delivers consolidated dashboards, automated reporting, custom analytics, and scalable insights for complex construction portfolios.