 Contact Us








What Is Tail Spend Analysis in Procurement?
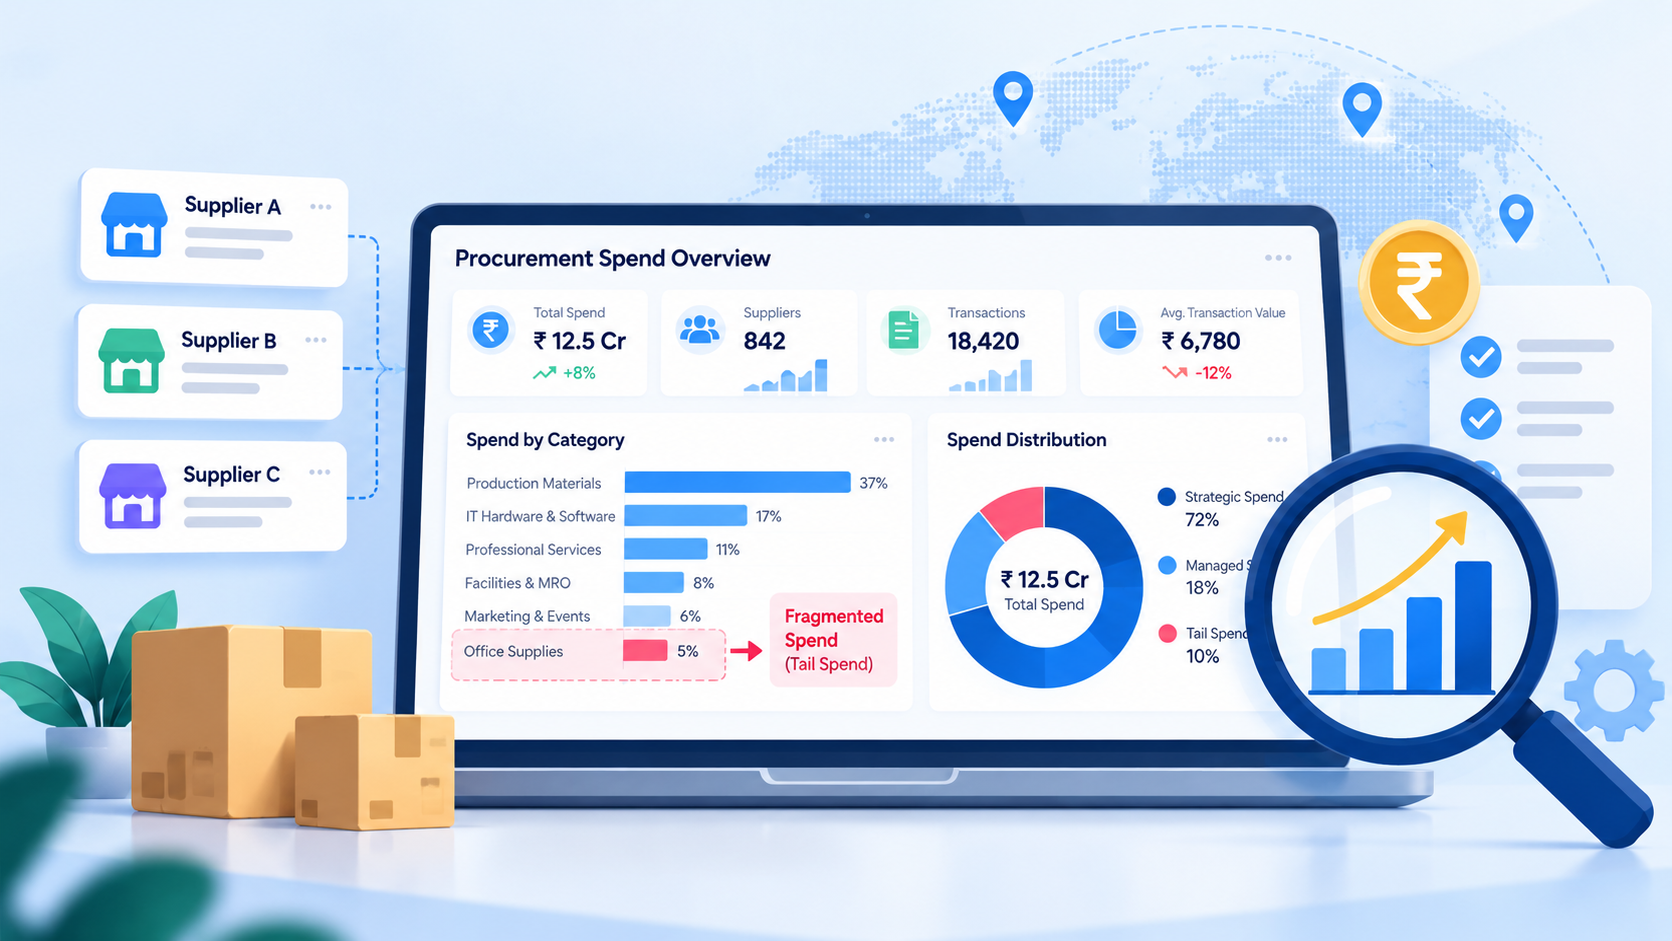
Tail spend analysis is the process of examining low-value, high-frequency, or fragmented purchases across an organization to identify spending patterns, supplier overlap, pricing inconsistencies, and opportunities for better procurement control.
Tail spend typically refers to the long tail of organizational purchasing: numerous transactions and suppliers that individually represent relatively small amounts but collectively account for a meaningful portion of procurement activity.
A commonly used illustration is the 80/20 pattern, in which a large share of transactions or suppliers accounts for a smaller share of total spend. However, this is a general model, not a universal ratio. Every organization should define tail spend according to its own purchasing data, supplier structure, and business requirements.
For example, a company might purchase office supplies from several vendors across multiple departments. Each purchase may appear insignificant when reviewed individually. Analyzing the transactions together may reveal repeated purchases, overlapping suppliers, inconsistent prices, or opportunities to consolidate demand.
The purpose of tail spend analysis is to make these patterns visible so procurement teams can decide which opportunities deserve further investigation.

How Does Tail Spend Analysis Work?
Tail spend analysis follows a structured process:

This process turns raw procurement data into information that supports better purchasing decisions.
Why Is Tail Spend Difficult to Identify?
Tail spend can be difficult to identify because purchasing information is often distributed across systems, departments, suppliers, and transaction records.
These visibility and control issues are connected to broader common procurement challenges, including maverick spending, inaccurate procurement data, and manual processes.
Several issues make the analysis more challenging.
Fragmented Supplier Records
The same supplier may appear under different names in purchase orders, invoices, or accounting systems. Without supplier-name standardization, procurement teams may underestimate how much they spend with a particular vendor.
Inconsistent Spend Categories
Departments may classify similar purchases differently. For example, office equipment, computer accessories, and IT peripherals may appear under separate categories even when some products overlap.
Inconsistent categorization makes it harder to compare purchases and identify opportunities across the organization.
Purchases Across Multiple Departments
Different teams may purchase similar products independently. One department might use an approved supplier, while another purchases from a different vendor for the same requirement.
Without a consolidated view, procurement may struggle to identify recurring demand or compare purchasing conditions.
Limited Visibility Into Off-Contract Purchases
Some transactions may occur outside preferred supplier arrangements or established purchasing processes. These purchases can make negotiated prices, contract coverage, and policy compliance more difficult to evaluate.
However, not every off-contract purchase is inappropriate. Emergency requirements, specialist services, and genuine supplier limitations may justify exceptions.
High Administrative Effort
Reviewing thousands of small transactions manually can consume significant time. Procurement teams may spend more effort collecting and organizing information than investigating the patterns that matter.
A structured tail spend analysis process helps address these challenges by standardizing the data and focusing attention on meaningful purchasing patterns.
What Are Common Examples of Tail Spend?
Tail spend examples in procurement can include recurring office supplies, IT peripherals, maintenance materials, courier services, and smaller professional-service purchases. Whether a purchase qualifies depends on the organization's spending thresholds, transaction patterns, and strategic requirements.
| Purchase category | Example | What procurement should investigate |
|---|---|---|
| Office supplies | Repeated purchases of stationery and consumables | Supplier overlap and recurring demand |
| IT peripherals | Keyboards, accessories, cables, and small equipment | Price differences and product standardization |
| Maintenance supplies | Small maintenance and repair orders | Repeat orders and supplier coverage |
| Marketing services | Freelancers, design services, and smaller agency engagements | Overlapping services and recurring requirements |
| Courier and delivery | Frequent shipments from different providers | Rate differences and delivery patterns |
| Professional services | One-off consulting or specialist services | Repeated requirements and opportunities for framework agreements |
| Facilities management | Cleaning materials and minor maintenance items | Category fragmentation and supplier duplication |
These examples are not automatically tail spend. Their classification depends on transaction size, purchasing frequency, supplier concentration, organizational thresholds, and strategic importance.
A low-value purchase may still be business-critical. Procurement should consider operational requirements and supply risk before consolidating suppliers or changing purchasing arrangements.
How to Perform Tail Spend Analysis: A Step-by-Step Process
To understand how to analyze tail spend, procurement teams should move from data collection and classification to validated decisions. The following nine steps provide a practical framework.
Step 1: Define the Scope and Tail Spend Threshold
Start by deciding what the organization wants to analyze.
Possible criteria include:
- Individual transaction value
- Annual spend by supplier
- Number of transactions
- Spend category
- Department or business unit
- Purchasing frequency
- Contract status
For example, an organization may decide to investigate suppliers receiving relatively small annual amounts but handling frequent transactions. Another may focus on categories with a large number of low-value purchase orders.
The threshold should reflect the organization's procurement structure rather than an arbitrary industry-wide number.
It is also important to distinguish between spend that is low in value and spend that is low in strategic importance. A low-value component that can stop production should not be treated in the same way as routine office consumables.
Output: A defined scope, a documented threshold, and a clear list of categories or transactions to investigate.
Step 2: Consolidate Procurement Spend Data
Collect the records needed to understand purchasing activity across the selected scope.
Depending on the organization's systems, relevant sources may include:
- Enterprise resource planning (ERP) records
- Purchase orders
- Supplier invoices
- Purchase requisitions
- Accounts payable data
- Corporate purchasing-card transactions
- Contract and supplier records
- Expense reports, where relevant
The objective is to create a sufficiently complete view of the purchases being analyzed.
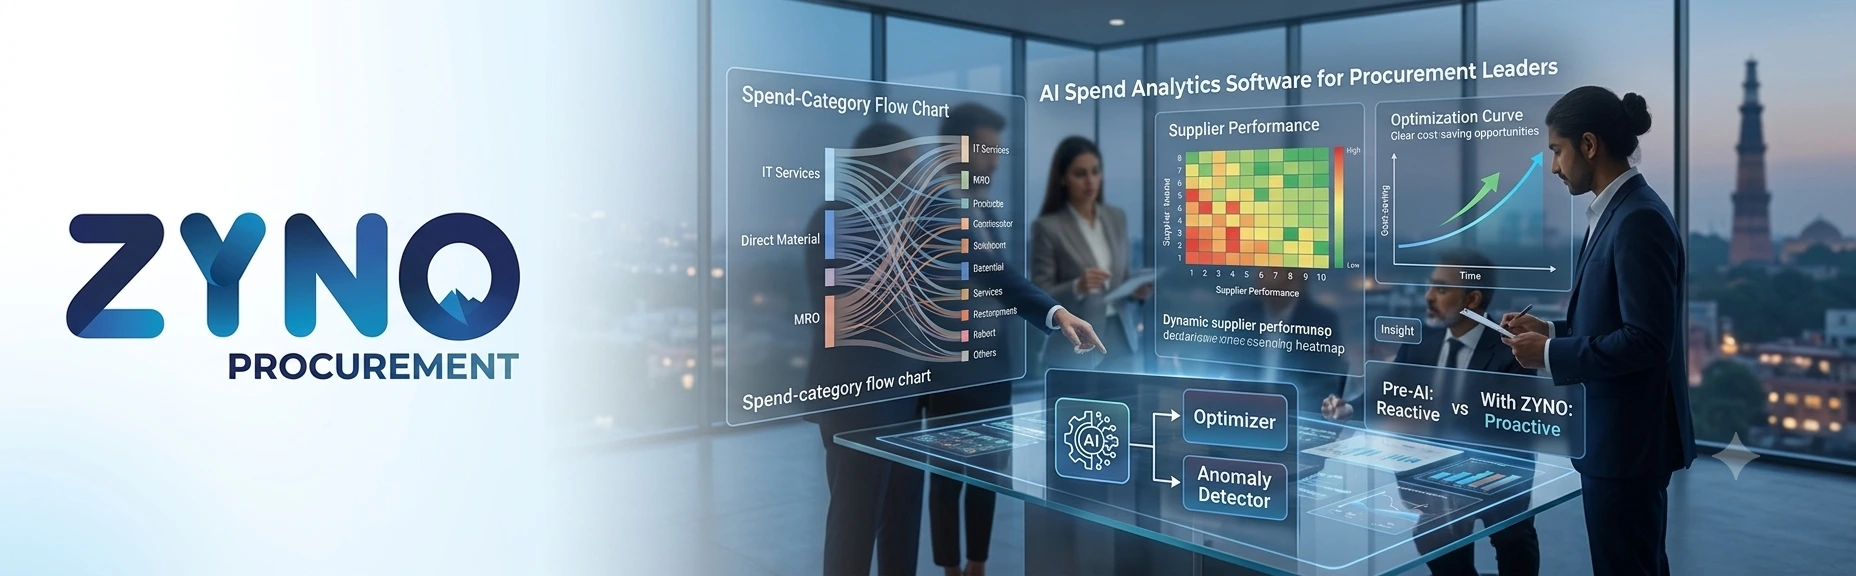
For a broader look at how AI supports procurement spend visibility and decision-making, read our guide to AI spend analytics for procurement leaders.
Each record should contain as many relevant fields as possible, including supplier name, transaction date, amount, currency, category, department, purchase order number, contract reference, and item description.
Before comparing totals, check whether the data covers the same reporting period and whether all sources are using consistent currency and accounting conventions.
Output: A consolidated dataset that can be analyzed across suppliers, categories, and transactions.
Step 3: Clean and Standardize Supplier and Transaction Data
Raw procurement data frequently contains inconsistencies that can distort the results.
For example, the same supplier might appear under different names in procurement records.

These records may refer to one supplier, related entities, or genuinely separate businesses. They should be investigated before being merged.
Data-cleaning activities should include:
- Standardizing supplier names and identifiers
- Correcting inconsistent category labels
- Normalizing currencies and units of measurement
- Checking missing supplier or transaction fields
- Identifying duplicate records
- Reviewing unusual or inconsistent transaction values
- Standardizing product descriptions where possible
Duplicate detection deserves particular attention. Two identical-looking invoice records may indicate a data-import duplication, but similar transactions can also represent legitimate separate purchases.
Validate the records before removing or combining them.
Output: A more reliable dataset with consistent supplier identities, transaction fields, and spend classifications.
Step 4: Categorize and Segment Tail Spend
Once the data is clean enough to analyze, divide it into meaningful groups.
Useful dimensions include:
- Supplier
- Procurement category
- Department
- Business location
- Transaction value
- Purchase frequency
- Contract status
- Direct versus indirect spend
Pareto analysis and ABC analysis can help procurement teams understand how spend is distributed.
Pareto analysis examines the relationship between cumulative spend and the suppliers or transactions contributing to it. ABC analysis groups items or suppliers into categories according to a defined measure of importance.
These methods can help distinguish high-value suppliers from the large number of smaller suppliers and transactions that make up the long tail.
However, a spend-value ranking alone may not be sufficient. A supplier with modest annual spend but frequent transactions could generate considerable administrative work. Similarly, a low-spend supplier could be operationally critical.
Output: A segmented view of purchasing activity that reveals where fragmented spend is concentrated.
Step 5: Analyze Supplier Concentration and Purchase Frequency
Next, investigate how purchasing activity is distributed across suppliers and categories.
Questions to ask include:
- How many suppliers serve the same category?
- Which suppliers receive frequent small orders?
- Are multiple departments buying the same products independently?
- Are similar products being purchased at different prices?
- Which categories have high transaction counts relative to their total spend?
- Are repeated purchases being processed individually when they could be planned together?
For example, suppose three suppliers provide comparable office consumables to different departments. Procurement should examine the products, delivery requirements, quality, prices, and purchasing conditions before deciding whether consolidating demand would be beneficial.
Supplier concentration and transaction frequency can reveal opportunities that a simple annual-spend report may not show.
Output: A shortlist of categories and suppliers that merit further investigation.
Step 6: Identify Price Variances, Duplicate Suppliers, and Off-Contract Spend
This stage examines the patterns that may explain why fragmented spend is difficult to control.
Price variances: Compare equivalent products or services after accounting for quantity, specifications, delivery, currency, and commercial terms.
Potential duplicate suppliers: Identify suppliers that may serve overlapping requirements. Confirm their legal identities and capabilities before proposing consolidation.
Off-contract purchases: Identify transactions that appear to fall outside an applicable contract or preferred supplier arrangement.
Repeated small orders: Look for patterns that could indicate an opportunity to plan demand or consolidate suitable purchases.
Potential duplicate payments: Investigate repeated invoice numbers, matching amounts, supplier identifiers, or other indicators that warrant an accounts-payable review.
An analytical signal is not proof of a problem. Different prices may reflect different product specifications, service levels, delivery terms, locations, or contract conditions.
The goal is to identify questions worth investigating, not to assume that every difference represents waste.
Output: A list of potential inefficiencies supported by transaction-level evidence.
Step 7: Prioritize the Highest-Value Opportunities
Not every opportunity should be addressed immediately.
Rank the findings according to factors such as:
- Potential financial impact
- Confidence in the analysis
- Ease of implementation
- Administrative effort
- Supplier and operational risk
- Business criticality
- Stakeholder readiness
For example, consolidating frequently purchased office consumables may be relatively straightforward if products are standardized and suitable suppliers are available.
Consolidating specialist maintenance suppliers may be more complicated if different locations require distinct capabilities or rapid emergency support.
Before consolidating suppliers, procurement teams should assess capability, quality, delivery reliability, total cost, and supply risk using appropriate supplier evaluation criteria.
A practical prioritization model is:
Priority = Potential impact + feasibility + confidence, evaluated alongside implementation effort and risk.
This is a decision framework rather than a universal mathematical formula. Organizations can assign numerical scores to these factors if they need a formal ranking process.
Output: A prioritized action list with clear owners, expected outcomes, and validation requirements.
Step 8: Validate Findings and Establish a Baseline
Before acting on the analysis, validate the findings with the relevant stakeholders.
Procurement should confirm the purchasing context, finance should verify spend figures and the savings baseline, and operational teams should assess service requirements and supply risk.
For each opportunity, document:
- The current purchasing situation
- The evidence supporting the finding
- The proposed change
- The expected financial or operational benefit
- Implementation costs and constraints
- The baseline against which results will be measured
Separate potential savings from negotiated savings, realized savings, and cost avoidance.
A supplier consolidation opportunity may look attractive in a report but produce limited net benefit after switching costs, logistics, or service requirements are considered.
Output: A validated opportunity with an agreed action plan and measurable baseline.
Step 9: Monitor Results and Repeat the Analysis
Tail spend analysis should be an ongoing process rather than a one-time exercise.
After implementing changes, review whether:
- Purchasing has moved to the intended suppliers
- Transaction volumes have changed
- Contract compliance has improved
- Unit prices and total purchasing costs have changed
- Administrative effort has decreased
- Service levels have remained acceptable
- Reported savings have been realized
Periodic reviews also help identify new suppliers, emerging purchasing patterns, and categories where fragmentation is returning.
The review frequency should reflect the organization's transaction volume, data availability, and procurement needs.
Output: A repeatable process that connects spend visibility with measurable purchasing improvements.
Tail Spend Analysis Example: How to Identify Fragmented Purchasing
Consider a hypothetical company that purchases office supplies and IT peripherals across several departments.
Its annual purchasing data shows the following activity:
| Supplier | Category | Annual spend | Transactions |
|---|---|---|---|
| Supplier A | Office supplies | ₹1,20,000 | 60 |
| Supplier B | Office supplies | ₹85,000 | 42 |
| Supplier C | Office supplies | ₹45,000 | 30 |
| Supplier D | IT peripherals | ₹90,000 | 18 |
| Total | — | ₹3,40,000 | 150 |

What Does the Data Reveal?
The three suppliers account for ₹2,50,000 in annual office-supplies spend across 132 transactions, creating an opportunity to investigate whether purchases can be managed more efficiently.
1. Are the purchases genuinely comparable?
Review product descriptions, quantities, quality specifications, delivery locations, and prices. Different products should not be treated as equivalent simply because they belong to the same category.
2. Is there an opportunity to consolidate demand?
If several departments repeatedly purchase equivalent products, procurement could investigate whether a preferred supplier arrangement, consolidated ordering, or a purchasing catalog would improve commercial terms and reduce administrative effort.
3. Would the proposed change create a measurable benefit?
Compare the current baseline with the expected costs of implementation. Include relevant delivery costs, switching costs, service requirements, and any additional administrative work.
What Should Procurement Do Next?
The company could create a prioritized opportunity for office supplies, validate the products and suppliers, negotiate suitable terms, and track subsequent purchasing against the baseline.
It should not automatically remove two suppliers merely because one supplier has the highest annual spend.
The correct decision depends on the evidence, the supplier capabilities, the total cost, and the organization's operational requirements.
This example demonstrates the central purpose of tail spend analysis: identify patterns in fragmented purchasing, investigate the opportunities, and make decisions based on validated data.
What Metrics Should You Track in Tail Spend Analysis?
The right metrics help procurement teams measure fragmentation, understand purchasing behavior, and monitor whether corrective actions are working.
| Metric | How to calculate it | Why it matters |
|---|---|---|
| Tail spend as a share of total spend | Tail spend ÷ total procurement spend × 100 | Measures the size of the defined tail-spend segment |
| Supplier count | Count of distinct suppliers in the selected scope | Helps identify supplier fragmentation |
| Transaction count | Number of eligible purchasing transactions | Reveals the volume of purchasing activity |
| Average transaction value | Total spend ÷ transaction count | Helps compare transaction patterns across categories |
| Off-contract spend rate | Eligible off-contract spend ÷ total spend in the defined scope × 100 | Measures purchasing outside applicable contracts |
| Supplier-count reduction (%) | (Baseline supplier count − current supplier count) ÷ baseline supplier count × 100 | Measures the net change in supplier count within a consistent scope |
| Validated realized savings | Baseline cost minus actual comparable cost, adjusted for relevant changes | Measures the financial outcome of implemented actions |
Each metric needs a clearly defined scope and reporting period.
For example, supplier count should use a consistent method for distinguishing legal entities, supplier locations, and duplicate records. Off-contract spend should be calculated only where contract applicability can be established.
Savings calculations should account for comparable quantities, specifications, timing, and relevant cost changes. A reduction in supplier count does not automatically mean procurement costs have decreased.
Likewise, a lower unit price does not necessarily mean lower total cost if delivery, quality, inventory, or administrative costs increase.
Tail Spend vs. Maverick Spend vs. Spot Buying
These terms are related, but they describe different aspects of procurement.
| Term | Meaning | Relationship to tail spend |
|---|---|---|
| Tail spend | The long tail of relatively small or fragmented purchases | Describes a segment of purchasing activity |
| Maverick spend | Purchases made outside established procurement policies, approval processes, or approved channels | Describes purchasing behavior or policy compliance |
| Spot buying | Purchasing for a particular requirement, often without a long-term sourcing arrangement | Describes a purchasing approach |
Tail spend can include compliant purchases made through approved channels. Maverick spend can occur in high-value categories as well as low-value categories. Spot buying may be appropriate for urgent, unusual, or one-time requirements.
For example, an employee purchasing routine office supplies from an unapproved vendor may create both tail spend and maverick spend. A low-value purchase made correctly through an approved supplier may be tail spend without being maverick spend.
Understanding the distinction helps procurement choose the right response. Fragmented spend may require better category visibility, while maverick spend may require clearer purchasing controls or improved access to approved suppliers.
How to Turn Tail Spend Analysis Into Procurement Savings
Tail spend optimization begins after fragmented purchasing has been identified and validated. The next step is to select an action that addresses the underlying issue without creating additional costs or risks.
Consolidate Similar Purchases Where Appropriate
Group equivalent purchasing requirements and evaluate whether fewer suppliers or consolidated orders would improve pricing, service, or administrative efficiency.
Before consolidating, consider supplier capacity, delivery requirements, geographic coverage, and business continuity.
Improve Preferred Supplier and Contract Coverage
Where recurring demand exists, procurement can assess whether preferred suppliers or suitable agreements would improve purchasing consistency.
Contracts should reflect actual requirements and include appropriate commercial terms, service levels, and review mechanisms.
Standardize Repeated Requirements
Unnecessary product variations can make purchasing more complex. Where business requirements allow, standardizing specifications may simplify comparison, reduce duplication, and improve demand visibility.
Standardization should not compromise safety, quality, compatibility, or operational needs.
Introduce Appropriate Purchasing Controls
Purchasing catalogs, approval workflows, spending limits, and clear preferred-supplier guidance can help employees make compliant purchasing decisions.
Controls should be proportionate to the risk and value of the transaction. Excessive approval requirements can increase administrative costs without creating corresponding benefits.
Track Actions and Validate Financial Outcomes
Assign each opportunity an owner, a target date, and a defined measure of success.
Compare actual purchasing with the baseline and account for implementation costs and other relevant changes. This makes it possible to distinguish realized savings from theoretical opportunities.
For more strategies to improve purchasing efficiency and validate savings, explore our guide on how to reduce procurement costs.
How Spend Analytics Software Supports Tail Spend Analysis
Tail spend analytics uses consolidated purchasing data to identify fragmented transactions, supplier overlap, and categories that merit further investigation. Tail spend software can support this work by organizing data and making supplier- and category-level patterns easier to review. The findings still need to be validated before procurement takes action.
Spend analytics software helps procurement teams consolidate purchasing information, categorize transactions, examine supplier and category spending, and identify patterns that may require further investigation.
For organizations with data distributed across departments and systems, these capabilities can reduce the manual effort involved in producing a consistent view of procurement spend.

How ZYNO Spend Analytics Can Help
ZYNO Spend Analytics helps procurement teams examine spending across suppliers, categories, and departments to investigate purchasing patterns and potential opportunities.
Its published capabilities include AI-powered spend categorization, supplier spend analysis, budget-versus-actual tracking, maverick-spend detection, custom reporting, and analysis of potential supplier-consolidation opportunities.
These capabilities are relevant to tail spend analysis because they support the underlying workflow: organize spend data, examine purchasing patterns, investigate opportunities, and monitor results.
For example, a procurement team investigating fragmented office-supplies purchases could use category and supplier reporting to identify where spend is distributed, examine repeated purchases, and decide which supplier arrangements merit review.
The team would then validate the findings and track the outcome of any changes.
Want to improve visibility into fragmented procurement spend? Explore ZYNO Spend Analytics or request a demo to see how its spend-analysis capabilities fit your procurement workflow.
Best Practices for Accurate Tail Spend Analysis
Use the following practices to make your analysis more reliable and actionable.
- Define tail spend consistently.Document the threshold, scope, reporting period, and criteria used to classify transactions.
- Standardize supplier records.Resolve naming inconsistencies and confirm supplier identities before calculating supplier counts or consolidation opportunities.
- Compare like-for-like purchases.Account for product specifications, quantities, locations, delivery terms, and contract conditions before drawing price comparisons.
- Separate signals from conclusions.Treat unusual prices, repeated purchases, and possible duplicate suppliers as findings to investigate rather than proof of waste.
- Consider operational and supplier risk.Evaluate quality, continuity, service requirements, and implementation costs before consolidating suppliers.
- Validate savings with finance.Establish an agreed baseline and distinguish potential savings, negotiated savings, cost avoidance, and realized savings.
- Review results periodically.Repeat the analysis to identify new purchasing patterns and check whether improvements are sustained.
Following these practices helps procurement teams avoid making decisions based solely on transaction value or supplier count.
Frequently Asked Questions About Tail Spend Analysis
What is tail spend analysis in procurement?
Tail spend analysis is the process of examining relatively small, frequent, or fragmented purchases to identify supplier overlap, purchasing patterns, price differences, and potential opportunities for improved procurement control.
How do you identify tail spend?
Start by defining the scope and threshold, then consolidate purchasing records, standardize supplier and category data, and analyze transactions by supplier, value, frequency, department, and contract status. Investigate the patterns that could support a meaningful procurement improvement.
What are examples of tail spend?
Common examples include office supplies, IT peripherals, maintenance materials, courier services, smaller marketing engagements, and recurring low-value purchases. Whether a transaction qualifies depends on the organization's purchasing structure and classification criteria.
What is the difference between tail spend and maverick spend?
Tail spend describes a segment of purchasing activity characterized by fragmented or relatively small purchases. Maverick spend refers to purchasing outside established procurement policies or approved channels. A purchase can be tail spend without being maverick spend, and maverick spend can occur in high-value categories.
What data is needed for tail spend analysis?
Useful data includes supplier names and identifiers, transaction dates, spend amounts, currencies, categories, item descriptions, departments, purchase order numbers, invoice references, and contract details. The exact requirements depend on the analysis and the systems available.
How often should organizations analyze tail spend?
The frequency depends on transaction volume, procurement complexity, and data availability. Organizations with frequent purchasing activity may benefit from regular or ongoing monitoring, while smaller organizations may begin with periodic reviews. The important point is to review results often enough to identify meaningful changes and validate implemented actions.
How can spend analytics software help identify tail spend?
Spend analytics software can organize purchasing data, categorize transactions, provide supplier and category views, and flag patterns that merit investigation. Procurement teams can use these insights to prioritize opportunities, but findings should be validated before making supplier or purchasing decisions.
Does tail spend always represent unnecessary spending?
No. Tail spend may include legitimate, compliant, and operationally important purchases. The purpose of analysis is to understand the spending pattern and identify appropriate improvements, not to eliminate small purchases indiscriminately.
Identify Hidden Patterns in Your Procurement Spend
Effective tail spend analysis starts with reliable data and a clear definition of the purchasing activity being examined. By consolidating transactions, standardizing supplier records, analyzing purchase frequency, and investigating fragmented categories, procurement teams can uncover patterns that individual purchase orders may conceal.
The next step is to prioritize those findings based on potential impact, feasibility, and risk. Some opportunities may support supplier consolidation or improved commercial terms. Others may require better purchasing controls, more consistent categorization, or improved visibility into recurring requirements.
The objective is not simply to reduce the number of suppliers or transactions. It is to improve how the organization understands, controls, and manages its purchasing activity.
For organizations seeking a more structured view of procurement spending, ZYNO Spend Analytics provides capabilities for examining spend across suppliers and categories, identifying potential opportunities, and monitoring procurement activity.
Better spend visibility gives procurement teams a stronger foundation for making informed decisions and measuring the results.










.webp)




.webp)

.webp)
.webp)




.webp)
.webp)
.webp)


.webp)
.webp)




.webp)

.webp)
.webp)
.webp)


.webp)


.webp)
_converted.webp)

_converted.webp)
.webp)
.webp)
.webp)
.webp)

(1).webp)
.webp)